Monitoring PostgreSQL Clusters in Kubernetes
Jonathan S. Katz
6 min readMore by this author
UPDATE: Read the updated "How to Setup PostgreSQL Monitoring in Kubernetes" which is even easier to set up and provides additional monitoring features!
The open source PostgreSQL Operator provides many features that are required to run a production database-as-a-service on Kubernetes, including provisioning PostgreSQL clusters, performing backup and restore operations, and manage high-availability runtime environments.
This time, we are going to look at a very important part of managing PostgreSQL in production, namely, how to monitor and visualize the health of PostgreSQL databases. A quick refresher on how to install the PostgreSQL Operator using Ansible, this article will show you how to configure and deploy a PostgreSQL cluster with full monitoring capabilities using pgMonitor in a Kubernetes environment!

Background on pgMonitor
pgMonitor is an open source project that combines a suite of tools to quickly stand up a monitoring environment that helps you to visualize what is occurring within your PostgreSQL clusters. It includes the open source time-series database Prometheus and the open source charting and dashboard visualization tool Grafana. Combined with several data exporters, pgMonitor facilitates the collection and visualization of important metrics (e.g. system resource utilization, database size, transaction wraparound, bloat, etc.) that you need to be aware of in your PostgreSQL environment.
Installation of the PostgreSQL Operator
As an initial step, it is of course necessary to install the PostgreSQL Operator in one of the supported Kubernetes environments. To ease the installation process, there is an Ansible-based installer which allows for automated deployment and configuration. You can read this guide for how to deploy the PostgreSQL Operator on GKE to help you get started.
Deploying Monitoring
The PostgreSQL Operator integrates use the open source Crunchy PostgreSQL Container Suite to provide containers that deploy an environment environment, which include:
- crunchy-collect, which contains the exporters that provide both system and PostgreSQL specific metrics
- crunchy-prometheus, which provides the Prometheus time-series database
- crunchy-grafana, which provides the Grafana frontend visualization tool to present the collected metrics. Grafana queries the Promteheus database and can display updated monitoring metrics in real time.
By default, the PostgreSQL Operator does not install Prometheus or Grafana, but you can configure your installer (for instance, the Ansible-based installer) to include these components, as they are required for setting up your monitoring environment!
Prerequisites
The following assumes that the installation prerequisites are satisfied for the PostgreSQL Operator as well as for enabling Prometheus and Grafana in the install. Using the Ansible-based installer for a Kubernetes environment, below are the inventory variables to consider:
| Name | Description |
|---|---|
| exporterport | Sets the port that the crunchy-collect listens on. Defaults to "9187" |
| grafana_admin_username | Set to configure the login username for the Grafana administrator. |
| grafana_admin_password | Set to configure the login password for the Grafana administrator. |
| grafana_install | Set to true to install Crunchy Grafana to visualize metrics. |
| grafana_storage_access_mode | Set to the access mode used by the configured storage class for Grafana persistent volumes. |
| grafana_storage_class_name | Set to the name of the storage class used when creating Grafana persistent volumes. |
| grafana_volume_size | Set to the size of persistent volume to create for Grafana. |
| metrics | Set to true enable performance metrics on all newly created clusters. This can be disabled by the client. |
| metrics_namespace | Configures the target namespace when deploying Grafana and/or Prometheus. The default is metrics |
| prometheus_install | Set to true to install Crunchy Prometheus time-series database. |
| prometheus_storage_access_mode | Set to the access mode used by the configured storage class for Prometheus persistent volumes. |
| prometheus_storage_class_name | Set to the name of the storage class used when creating Prometheus persistent volumes. |
| prometheus_volume_size | Set to the size of persistent volume to create for Prometheus. |
At this time the PostgreSQL Operator Playbooks only support storage classes. For more information on storage classes see the official Kubernetes documentation.
Installing the Metrics Stack
The following command should be run in the directory where the PostgreSQL Operator playbooks are located. See the Ansible directory in the PostgreSQL Operator project for the inventory file, main playbook and Ansible roles.
- On a Linux / MacOS / Windows with the Ubuntu subsystem host with Ansible installed we can run the following command to install the Metrics stack:
ansible-playbook -i /path/to/inventory --tags=install-metrics main.yml
If you have not already installed the PostgreSQL Operator you can install both the Operator and the metrics stack using the following command (though you will have to configure the rest of your inventory file):
ansible-playbook -i /path/to/inventory --tags=install,install-metrics main.yml
Verifying the Installation of Metrics Stack
This may take a few minutes to deploy. To check the status of the deployment run the following:
kubectl get deployments -n <METRICS_NAMESPACE>
kubectl get pods -n <METRICS_NAMESPACE>
Verifying the Grafana Installation
In a separate terminal we need to setup a port forward to the Grafana deployment to ensure connection can be made outside of the cluster:
kubectl port-forward <GRAFANA_POD_NAME> -n <METRICS_NAMESPACE> 3000:3000
In a browser navigate to https://127.0.0.1:3000 to access the Grafana dashboard.
Verify Prometheus Installation
In a separate terminal we need to setup a port forward to the Crunchy Prometheus deployment to ensure connection can be made outside of the cluster:
kubectl port-forward <PROMETHEUS_POD_NAME> -n <METRICS_NAMESPACE> 9090:9090
In a browser navigate to https://127.0.0.1:9090 to access the Prometheus dashboard.
Start Monitoring Your Clusters
Once the metrics stack is installed in your Kubernetes environment, you now have the ability to collect and visualize metrics associated with Kubernetes deployed PostgreSQL clusters and hosts. To get started, create a PostgreSQL cluster with metric exporters use the pgo create cluster command with the --metrics option, e.g.
pgo create cluster newcluster --metrics
Note: In the PostgreSQL Operator 4.0, based on how you set up your environment variables, you may need to specify the specific namespace to deploy the cluster in as well. This is accomplished with the -n flag, e.g. pgo create cluster -n pgouser1 newcluster --metrics.
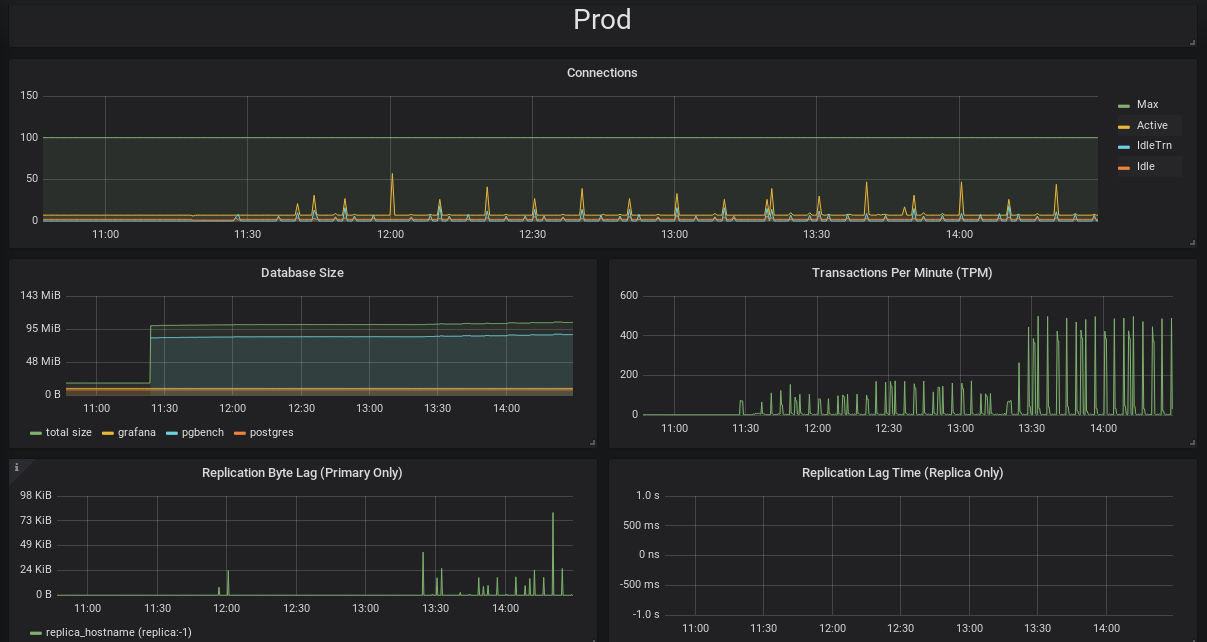
Your cluster is now set up to start collecting metrics! pgMonitor includes some helpful metrics for checking on the health of your databases, including:
- Connection counts: how much is your system being accessed and if connections are hanging
- Database size: how much disk your cluster is using
- Replication lag: know if your replicas are falling behind in loading data from your primary
- Transaction wraparound: don’t let your PostgreSQL database stop working
- Bloat: how much extra space are your tables and indexes using
- System metrics: CPU, Memory, I/O, uptime
Looking Ahead
Monitoring of PostgreSQL containers and associated infrastructure is an evolving area introducing new challenges as well as opportunities. We welcome and encourage contributions to advance those capabilities through the enhancement of the open source pgMonitor and PostgreSQL Operator projects.
Related Articles
- British Columbia, Time Zones, and Postgres
6 min read
- Postgres Serials Should be BIGINT (and How to Migrate)
11 min read
- Postgres 18 New Default for Data Checksums and How to Deal with Upgrades
4 min read
- PostGIS Performance: Simplification
3 min read
- How to Read Postgres EXPLAIN: A Guide to Scan Types
9 min read