Patroni & etcd in High Availability Environments
Caitlin Strong
13 min readMore by this author
Crunchy Data products often include High Availability. Patroni and etcd are two of our go-to tools for managing those environments. Today I wanted to explore how these work together. Patroni relies on proper operation of the etcd cluster to decide what to do with PostgreSQL. When communication between these two pieces breaks down, it creates instability in the environment resulting in failover, cluster restart, and even the the loss of a primary database. To fully understand the importance of this relationship, we need to understand a few core concepts of how these pieces work. First, we'll start with a brief overview of the components involved in HA systems and their role in the environment.
Overview of HA Infrastructure
HA systems can be setup in a single or multi-datacenter configuration. Crunchy supports HA on cloud, traditional, or containerized infrastructure. When used in a single datacenter, the environment is typically setup as a 3-node cluster on three separate database hosts. When used across multiple datacenters, the environment typically has an active datacenter, where the primary HA cluster and applications are running, and one or more standby datacenters, each containing a replica HA cluster that is always available. Although the setup may be different, the basic components and primary function of the environment remains the same.
Main HA components
For this article, we will focus on three basic components which are essential in both single datacenter and multi-datacenter environments:
- PostgreSQL cluster: the database cluster, usually consisting of a primary and two or more replicas
- Patroni: used as the failover management utility
- etcd: used as a distributed configuration store (DCS), containing cluster information such as configuration, health, and current status.
How HA components work together
Each PostgreSQL instance within the cluster has one application database. These instances are kept in sync through streaming replication. Each database host has its own Patroni instance which monitors the health of its PostgreSQL database and stores this information in etcd. The Patroni instances use this data to:
- keep track of which database instance is primary
- maintain quorum among available replicas and keep track of which replica is the most "current"
- determine what to do in order to keep the cluster healthy as a whole
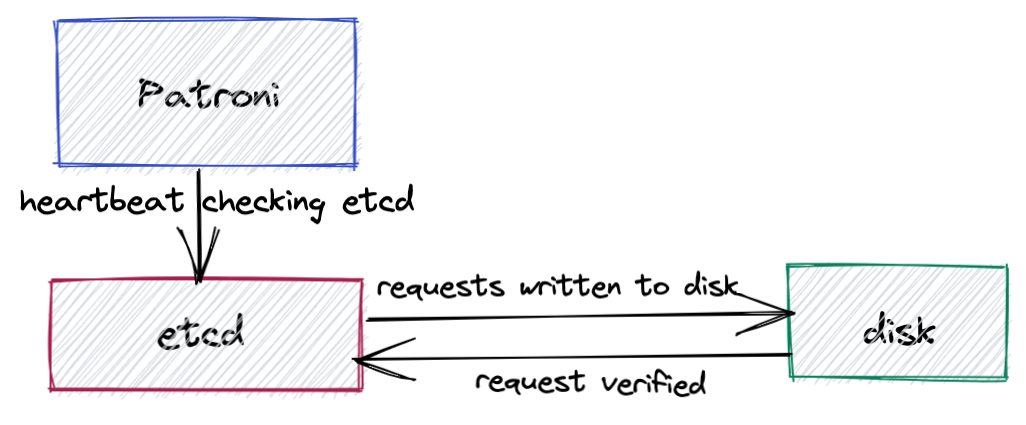
Patroni manages the instances by periodically sending out a heartbeat request to etcd which communicates the health and status of the PostgreSQL instance. etcd records this information and sends a response back to Patroni. The process is similar to a heart monitoring device. Consistent, periodic pulses indicate a healthy database.
etcd Consensus Protocol
The etcd consensus protocol requires etcd cluster members to write every request down to disk, making it very sensitive to disk write latency. If Patroni receives an answer from etcd indicating the primary is healthy before the heartbeat times out, the replicas will continue to follow the current primary.
If the etcd system cannot verify writes before the heartbeats time out, or if the primary instance fails to renew its status as leader, Patroni will assume the cluster member is unhealthy and put the database into a fail-safe configuration. This will trigger an election to promote a new leader and the old primary is demoted and becomes a replica.
Common Causes of Communication Failures
Communication failure between Patroni and etcd is one of the most common reasons for failover in HA environments. Some of the most common reasons for communication issues are:
- an under-resourced file system
- I/O contention in the environment
- network transit timeouts
Under-resourced file system
Because HA solutions must be sufficiently resourced at all points at all times to work well, the proper resources must be available to the etcd server in order to mitigate failovers. As mentioned before, etcd consensus protocol requires etcd cluster members to write every request down to disk and every time a key is updated for a cluster, a new revision is created. When the system runs low on space (usage above 75%), etcd goes read/delete only until revisions and keys are removed or disk space is added. For optimal performance, we recommend keeping disk usage below 75%.
I/O contention
The etcd consensus protocol requires etcd cluster members to write every request down to disk, making it very sensitive to disk write latency. Systems under heavy loads, particularly during peak or maintenance hours, are susceptible to I/O bottlenecks as processes are forced to compete for resources. This contention can increase I/O wait time and prevent Patroni from receiving an answer from etcd before the heartbeat times out. This is especially true when running virtual machines as neighboring machines can impact I/O. Other sources of contention might be heavy I/O from PostgreSQL and excessive paging due to high connection rates and/or memory starvation.
Network Delay
The etcd system, which is critical for the stability of the HA solution, is experiencing issues that register as network transit timeouts. This could be due to either actual network timeouts or massive resource starvation at the etcd level. If you notice timeout errors typically coincide with periods of heavy network traffic, then network delay could be the root cause of these timeout errors.
Diagnosing the system
Confirm the issue
When troubleshooting your system, the best place to start is by checking the logs. If communication issues between Patroni and etcd are at the heart of the issue, you will most likely see errors in your log files like the examples below.
First, check PostgreSQL logs in order to rule out any issues with the PostgreSQL host itself. By default, these logs are stored under pg_log in the PostgreSQL data directory. If your logs are not in the default location, you can determine the exact location by running the command show log_directory ; in the database. Check for any indication of other PostgreSQL processes crashing or being killed prior to the error message. For example:
WARNING:  terminating connection because of crash of another server process
DETAIL:  The postmaster has commanded this server process to roll back the current transaction and exit, because another server process exited abnormally and possibly corrupted shared memory.
HINT:  In a moment you should be able to reconnect to the database and repeat your command.
If no other PostgreSQL processes crashed, check the Patroni logs for any errors or events that may have occurred shortly before this error was logged by PostgreSQL. Messages like demoted self because failed to update leader lock in DCS and Loop time exceeded indicate communication and timeout issues with etcd.
Feb  1 13:45:05 patroni: 2021-02-01 13:45:05,510 INFO: Selected new etcd server http://10.84.32.146:2379
Feb  1 13:45:05 patroni: 2021-02-01 13:45:05,683 INFO: demoted self because failed to update leader lock in DCS
Feb  1 13:45:05 patroni: 2021-02-01 13:45:05,684 WARNING: Loop time exceeded, rescheduling immediately.
Feb  1 13:45:05 patroni: 2021-02-01 13:45:05,686 INFO: closed patroni connection to the postgresql cluster
Feb  1 13:45:05 patroni: 2021-02-01 13:45:05,705 INFO: Lock owner: None; I am pg1
Feb  1 13:45:05 patroni: 2021-02-01 13:45:05,706 INFO: not healthy enough for leader race
Feb  1 13:45:06 patroni: 2021-02-01 13:45:06,657 INFO: starting after demotion in progress
Feb  1 13:45:09 patroni: 2021-02-01 13:45:09,521 INFO: postmaster pid=1521
Feb  1 13:45:11 patroni: /var/run/postgresql:5434 - rejecting connections
If you see a message like the one above, the next step is to check etcd logs. Look for messages logged right before the message logged in the Patroni logs. If communication issues are to blame for your environment's behavior, you will likely see errors like the one below.
Feb  1 13:44:21 etcd: failed to send out heartbeat on time (exceeded the 100ms timeout for 39.177252ms)
Feb  1 13:44:21 etcd: server is likely overloaded
Narrow down the cause
Check disk space
To see if a lack of disk space is the root of the problem, check the disk space available to the etcd system by running the linux command df on the etcd directory, typically /var/lib/etcd. The disk space available to this directory should be checked on all servers, including the Patroni server. For optimal performance, we recommend keeping disk usage below 75%. If the amount of space used is approaching or exceeding 75%, then allocating more space to this directory may resolve the issue. (More information in the Recommendation section further below.)
Analyze performance metrics
If the file system still has plenty of space available, we will need to dig deeper to find the source of the problem by analyzing the overall performance of the system. A good place to start is with the sar command which is part of the Linux sysstat package and can be run on the system by any user. This command provides additional information about the system, such as system load, memory and CPU usage which can be used to pinpoint any bottlenecks or pain points in your system. By default, the command displays CPU activity and collects these statistics every 10 minutes.
The nice thing about sar is that it stores historical data by default with a one-month retention. On RHEL/CentOS/Fedora distributions, this data is stored under /var/log/sa/ for Debian/Ubuntu systems, it's stored under /var/log/sysstat/. The log files are named sa*dd*, where dd represents the day of the month. For example, the log file for the first of the month would be sa01, the file for the 15th would be sa15.
This means that if the sysstat package was installed and running on the server when the etcd timeout occurred, we can go back and analyze the performance data around the time of the incident. Note: Because the sar command only reports on local activities, each of the servers in the etcd quorum will need to be checked. If the sysstat package was not installed or was not running during the time of the incident, it will need to be installed and enabled so that this information will be available the next time the etcd timeout issue occurs. For our purposes, we will assume the package was running.
Going back to the etcd log example we looked at earlier, we can see that the timeout issue occurred at 13:44:21 on the first of the month. By specifying the relevant file name along with a start and end time in our sar command, we can extract the information relevant to the time of the incident. Note: Use a start time slightly before the timestamp of the error in order to see the state of the system before the timeout was triggered. For example:
sar -f /var/log/sa/sa01 -s 13:35:00 -e 13:50:00
Where:
-f: file name and path-s: start time, in HH:MM:SS format-e: end time, in HH:MM:SS format
Should give us an output that looks something like:
$ sar -f /var/log/sa/sa01 -s 13:30:00 -e 13:51:00

01:30:01 PM     CPU      %usr     %nice      %sys    %iowait    %steal    %idle
01:40:01 PM     all      2.71      0.00      2.02      0.92      0.00     94.32
01:50:01 PM     all      2.10      0.00      1.79      7.86      0.00     88.22
Average:        all      2.41      0.00      1.91      4.39      0.00     91.27
Here we can see a jump in %iowait between 1:40pm and 1:50pm, indicating a sudden burst of activity around the time of the etcd error, as suspected.
Adding the -d flag to the command will let us take a closer look at each device block and allow us to compare how long the I/O request took from start to finish (await column) with how long the requests actually took to complete (the svctm column):
$ sar -f /var/log/sa/sa01 -s 13:30:00 -e 13:51:00 -d

01:30:01 PM       DEV       tps  rd_sec/s  wr_sec/s  avgrq-sz  avgqu-sz     await     svctm     %util
01:40:01 PM    dev8-0      4.36      2.19     49.63     11.88      0.03      7.59      5.67      2.47
01:40:01 PM    dev8-1      0.66      1.92    317.55    480.49      0.05     74.76      6.63      0.44
01:40:01 PM    dev8-2      0.09      0.85      1.05     21.13      0.00      4.31      4.31      0.04
01:40:01 PM    dev8-3      7.14      0.43    175.16     24.58      0.06      7.97      3.81      2.72
01:50:01 PM    dev8-0      4.40      1.91     45.88     10.86      1.00    226.16     28.65     12.61
01:50:01 PM    dev8-1      0.48      0.00     10.07     20.83      0.12    245.13     73.72      3.56
01:50:01 PM    dev8-2      0.24      0.00     57.48    241.24      0.27   1123.66    235.00      5.60
01:50:01 PM    dev8-3      6.91      0.01    165.57     23.98      0.78    112.61     19.24     13.28
Since requests can lose time waiting in a queue if the device is already busy and won't accept additional concurrent requests, it is not unusual for the service time to be slightly smaller than the waiting time. However, in this example we can see that I/O requests on dev8-2 took an average of 1123.66ms from start to finish even though they only took an average of 235ms to actually complete, which is a significant increase from where is was previously, when both await and svctm only took 4.31ms. Considering these times are averages, it isn't hard to imagine that any spikes that may have occurred were likely much higher than the time shown in this output. If you find similar jumps in your environment, then an under-resourced system is likely the cause of the timeout errors.
Solutions and Suggested Steps
Now that we have a better idea of what might be causing the issue, here are some things we can do to fix it:
Increase resources
If the etcd directory is running low on space (i.e. the amount of space used is approaching or exceeding 75%), allocate more disk space to this directory and see if the heartbeat timeout issue is resolved. Similarly, if you find spikes of %iowait and I/O contention that correlate with the time of the timeout incident, we recommend increasing the IOPS on all systems running the etcd quorum.
Find the cause of I/O spikes
While increasing resources may help in the short term, identifying the cause of the await jump is key to determining a long-term solution. Work with your systems administrator to diagnose and resolve the underlying cause of I/O contention in your environment.
Relocate your etcd
If etcd is sharing a storage device with another resource, consider relocating the etcd data to its own dedicated device to ensure that etcd has a dedicated I/O queue for any I/O that it needs. In a multi-node environment, this means one node should be dedicated entirely to etcd. For optimum performance choose a device with low-latency networking and low-latency storage I/O.
Please note: If the underlying issue is the disk itself, rather than just the disk performance, moving the etcd data to a new storage device may not fully correct the issue if other parts of the cluster are still reliant on the disk.
Resolve network delay
If communication errors persist after you have increased resources to the etcd system, then the only remaining cause is network delay. For a long-term solution, you will need to work with your network administrator to diagnose and resolve the underlying cause of network delay in your environment.
Increase Timeout Intervals
While increasing resources and resolving the underlying issue of I/O contention and/or network delay are the only way to fully resolve the issue, a short-term solution to the problem would be to increase the timeout interval. This will give etcd more time to verify and write requests to disk before timing out and Patroni triggers an election.
If you are using Crunchy Data's High-Availability solution, this can be accomplished by changing the heartbeat_interval parameter in your group_vars/etcd.yml file and rerunning your playbook. Below is an example as to how it should look like:
etcd_user_member_parameters:
  heartbeat_interval: <value>
If you are using another solution in your environment, you should be able to increase this setting by changing the parameter in your etcd configuration file, typically located under /etc/default/etcd.
IMPORTANT: Setting the heartbeat interval to a value that's too high will result in long election timeouts and the etcd cluster will take longer to detect leader failure. This should be treated as a last-ditch effort and only used as a way of mitigating the issue until the underlying cause can be diagnosed and resolved.
Conclusion
Hopefully you now have a better understanding of why Patroni's timely and consistent communication with etcd is essential to maintaining a healthy HA environment as well what you can do to diagnose and fix communication issues between the two.
Crunchy Data strongly recommends ensuring a good, reliable network to your DCS to prevent failover from occurring. We also strongly recommend monitoring your environment for disk space issues, archiving issues, failover occurrences, and replication slot failures.