PostgreSQL Monitoring for Application Developers: The Vitals
Jonathan S. Katz
9 min readMore by this author
My professional background has been in application development with a strong affinity for developing with PostgreSQL (which I hope comes through in previous articles). However, in many of my roles, I found myself as the "accidental" systems administrator, where I would troubleshoot issues in production and do my best to keep things running and safe.
When it came to monitoring my Postgres databases, I initially took what I knew about monitoring a web application itself, i.e. looking at CPU, memory, and network usage, and used that to try to detect issues. In many cases, it worked: for instance, I could see a CPU spike on a PostgreSQL database and deduce that there was a runaway query slowing down the system.
Over time, I learned about other types of metrics that would make it easier to triage and mitigate PostgreSQL issues. Combined with what I learned as an accidental systems administrator, I've found they make a powerful toolkit that even helps with application construction.
To help with sharing these experiences, I set up a few PostgreSQL clusters with the PostgreSQL Operator monitoring stack. The Postgres Operator monitoring stack uses the Kubernetes support of pgMonitor to collect metrics about the deployment environment (e.g. Pods) and the specific PostgreSQL instances. I'll also add a slight Kubernetes twist to it, given there are some special consideration you need to make when monitoring Postgres on Kubernetes.
We'll start with my "go to" set of statistics, what I call "the vitals."
The Vital Statistics: CPU, Memory, Disk, and Network Utilization
For me as an application developer, understanding the consumption of what I term the "vital stats," i.e. the utilization of the four following resources:
- CPU
- Memory
- Disk
- Network
While these statistics may not tell you exactly what's wrong with my PostgreSQL cluster, they can give you both an overall glimpse of how healthy the system is (hence "vitals") and a direction of what to check next.
For example, pretend there's a report that the application is having performance issues and we want to try to pinpoint which system is causing it. We want to check the database: a quick look at the vital stats can determine if we need to investigate PostgreSQL further, or if we should spend our efforts on some part of the system.
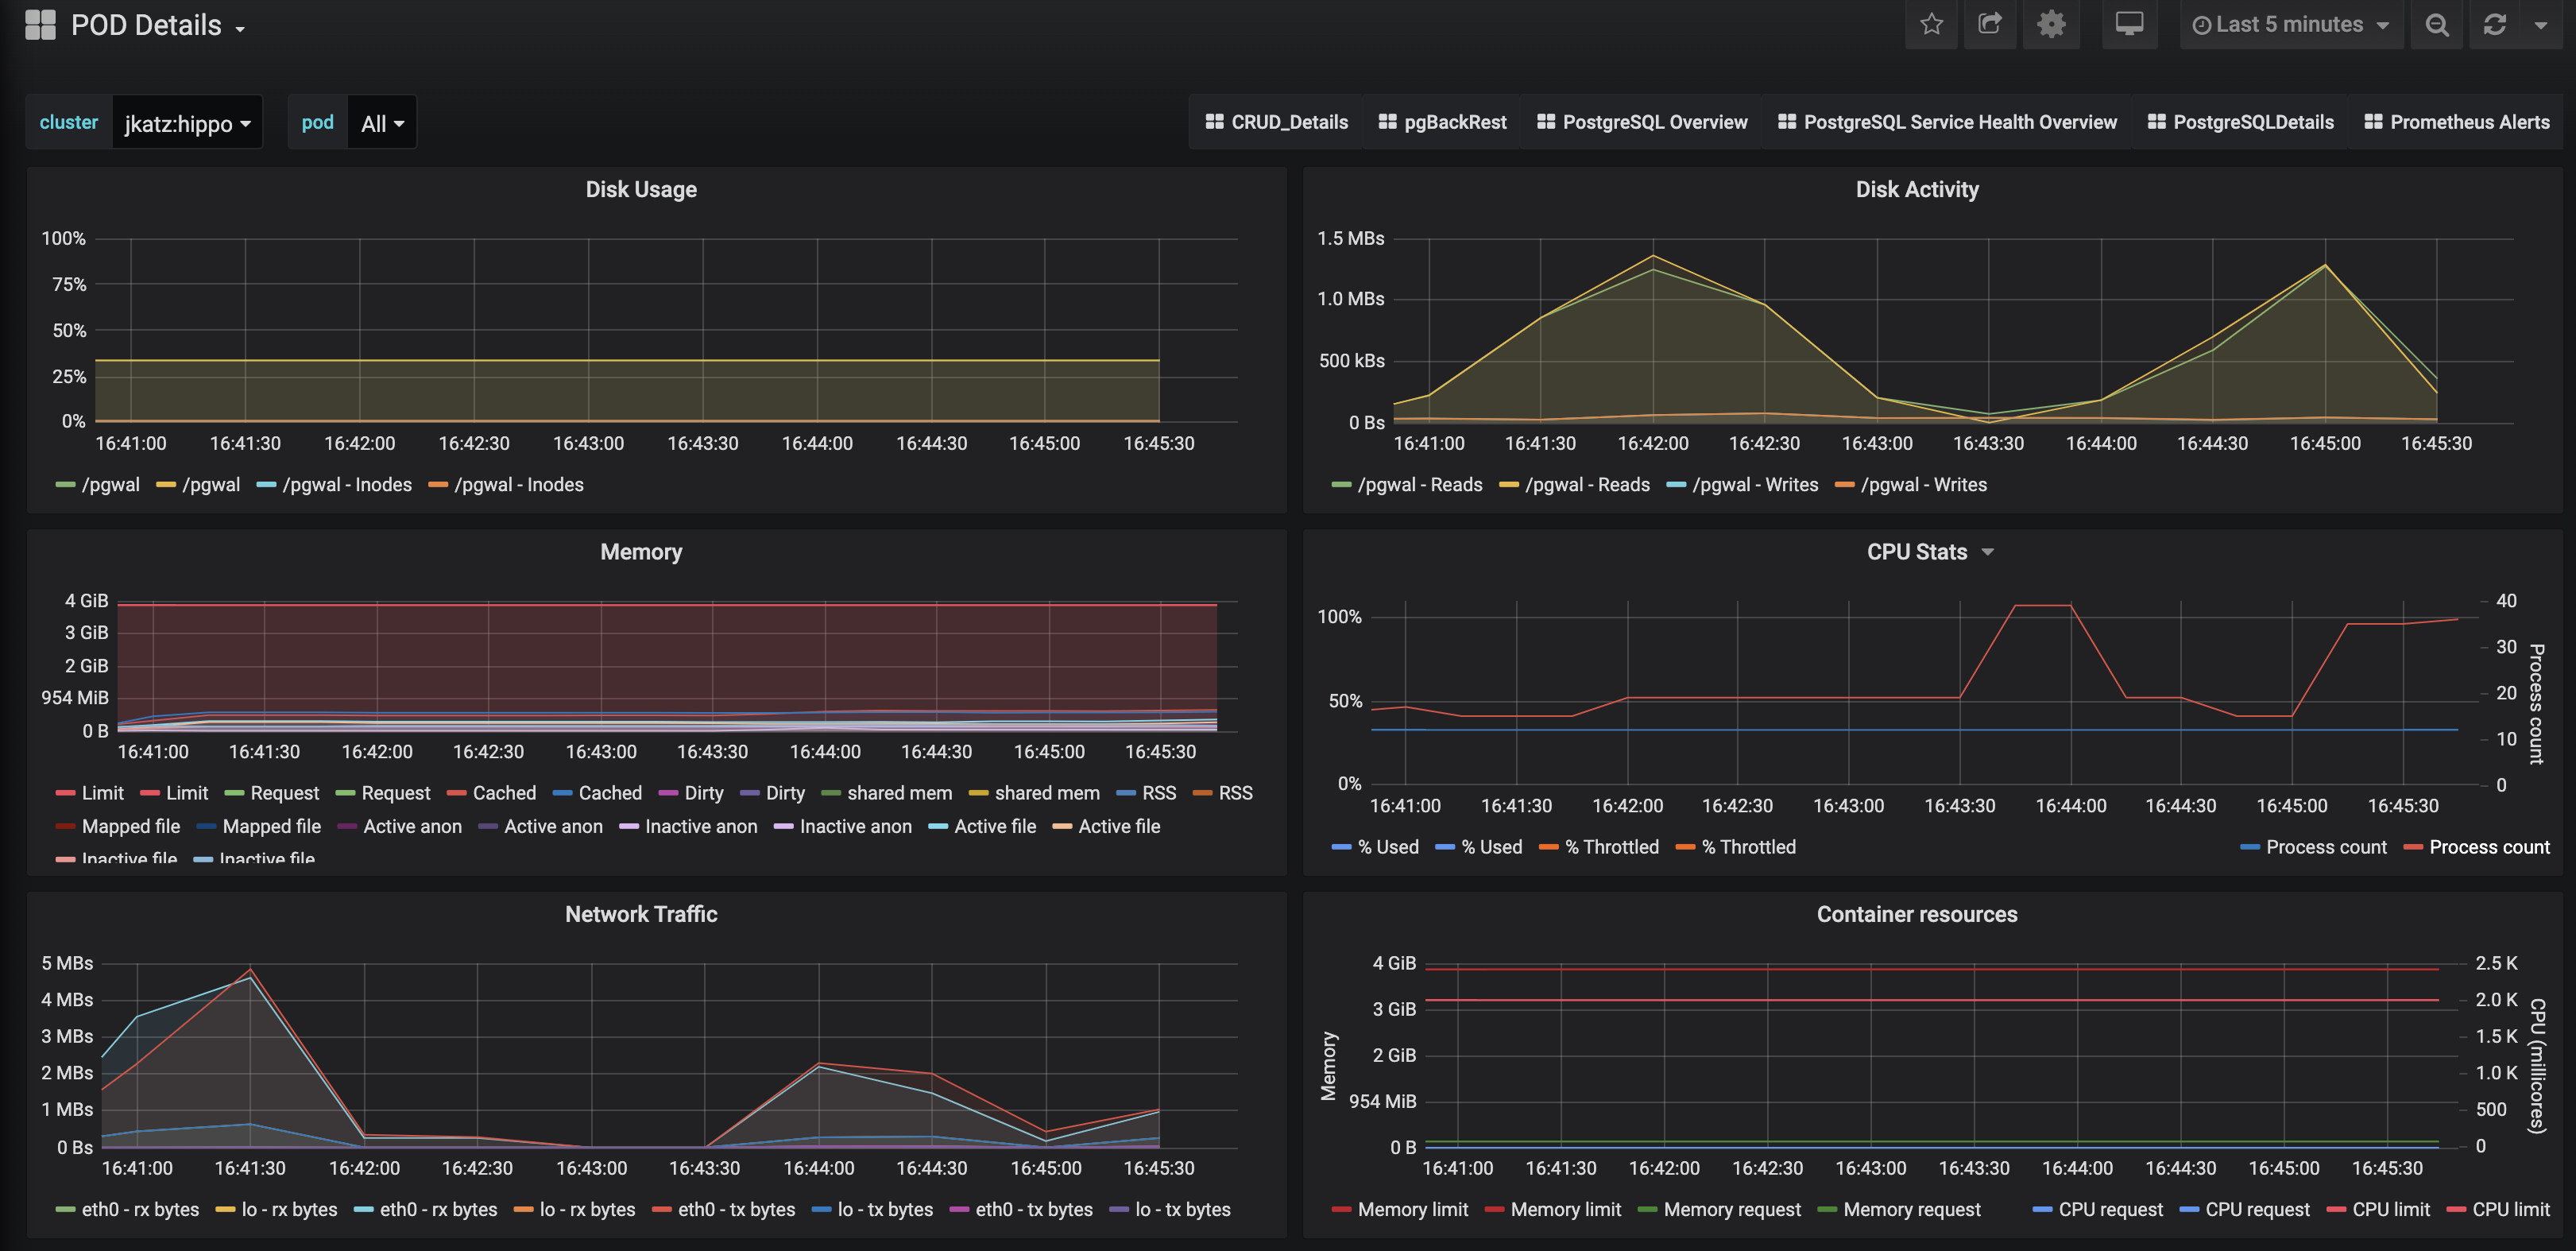
Here is what we can glean from these vital charts, going from top-to-bottom:
Disk Usage
The raison d'être for Postgres is to store data on disk (and, when called upon, efficiently retrieve it!). In order for PostgreSQL to do that, there needs to be enough space left on disk for it to write to it: if there isn't, Postgres will panic and refuse to start.
The pgMonitor disk usage chart will indicate which of the volumes is out-of-disk; this may be enough to determine the problem (e.g. "there's on space left in the data directory!") but perhaps not the cause: perhaps the server logs have not been rotated, or a replication slot has not been acknowledged. You may need to look at some more of the DBA-oriented charts to figure that out (the subject of the next article!).
On the application side, one of the symptoms of Postgres being out-of-disk is that your application will be unable to connect to the database. This is why disk usage is arguably the most important statistic to monitor, as out-of-disk errors can result in downtime.
Disk Activity
Monitoring disk activity relates to the overall performance of your database. For example, if you have a write-heavy application (i.e. storing data, but not really retrieving it), you want to ensure that you have enough throughput to prevent performance bottlenecks.
To make sense of disk activity, you generally need to combine it with other metrics, such as ones that indicate data access patterns (more on that in the next article). Disk activity can help you diagnose performance issues, help with tuning your PostgreSQL configuration, or indicate that you may need to make changes at your storage layer.
Issues related to disk activity can manifest as your application underperforming. However, to truly make the diagnosis, you will need to drill in further both to understand how your application is accessing your data and more.
Memory
Did you know that PostgreSQL caches data in memory? This is what the famous shared_buffers setting controls: how much memory PostgreSQL should allocate for its cache. How the PostgreSQL shared buffers work is a blog post (or six) in itself, but note that this setting, the size of your database's working set, and the overall memory available to your system do have an impact on your system's performance!
The memory chart can tell us a few things about the overall health of our cluster, for but, similar to disk activity, may need to be combined with another chart to diagnose an issue. While it may help determine if you are having a performance issue or a misconfiguration (e.g. you expect shared buffers to be at a certain value but its well below), it is typically only a starting point in diagnosing a problem.
However, this is an example of why I consider the memory chart a "vital:" if everything appears normal with it and the other vitals, you can move on to trying to troubleshoot other parts of the system.
Let me add a Kubernetes twist: the memory limit. You can see in the chart above that we track the memory limit for a Pod. If your application is experiencing issues such as connection drops (symptoms include downtime), you may want to check if your Pod is exceeding its memory limit. Pods that exceed memory limits may receive a visit from the OOM killer, so you may either need to adjust your memory limits or change some of your Postgres configuration.
CPU
Tracking CPU consumption can often tell you that there is a problem, though you almost definitely need to combine it with some other metric or understanding of the application to determine what that problem is.
If the database is consuming too much CPU, your application may experience degraded performance or, if it's expecting some action to occur asynchronously, may take longer to receive updates.
I've actually been bitten (read: caused) both sets of issues in production. In fact, both times it happened to be two types of runaway recursive queries. In one case, I had an infinite recursive query that was available to anyone who made a request to the web server. In other words, I created a perfect path to pegging the database CPU at 100% and causing the whole system to come to a grinding halt.
(Epilogue: if you have hierarchical models, ensure you can't have cycles either with a constraint or by having a loop breaking mechanism in your recursive queries).
The other case had a recursive query that was very slow (read: pegged the database CPU at 100%) but occurred as part of an asynchronous job. While this did not directly affect the application itself, users would notice that updates took a long time, leading to an overall experience degradation.
(Epilogue: there's a big difference between UNION and UNION ALL).
Why do I mention these stories? First, to show that to err is human, but also that database CPU utilization can be a good starting point for troubleshooting an issue, but it will almost definitely require looking further into your metrics or application to find the root cause.
Network Traffic
Networking can often be the "silent killer" of application performance degradation. I would often see networking issues as "transient errors:" perhaps a blip in DNS or a momentary surge in traffic causing a brief outage.
However, too much traffic between your database and application could help explain why the application is performing slowly.
A common issue I've seen is when a lot of data is transferred to the application for further computation where that computation could be handled within the database itself. For example, finding the sum of a bunch of numbers. Imagine I need to sum up 1000 records, I could:
- Return all 1000 records to the application and perform the sum there
- Perform the sum on the database server and return 1 record
Option #2 eases the burden on the network, though places more work (CPU, memory, and potentially disk activity) on PostgreSQL.
Which perhaps leads into a final point about all of the vital statistics: they all have tradeoffs that you need to be aware of. In the above example, we can reduce the burden on sending traffic over the network, but at a cost to the other vitals. However, we have to determine which costs more: application CPU + network transfer vs. database CPU + memory and potentially disk (which, if you're in the cloud, your disk could be on a network too).
That said, you will have to run your own experiments to determine what makes the most sense for your application, though to bias the outcome for the case above, in my experience, I usually rely on PostgreSQL for those computations.
Conclusion: Vitals Provide Direction
The vital statistics for Postgres are primarily here to provide you direction on what to look at next: they may indicate that there is an aspect of the system for you to drill into, or that everything is operating normally. These are always the numbers I would look at first in my accidental systems administrator days: if one of these numbers seemed off, it meant I should continue looking at Postgres for the source of the issue.
Now, there were exceptions to the rule: sometimes the vitals would appear normal but PostgreSQL still had an issue: you may still want to check the Postgres server logs for errors.
So, what are other statistics to look into? In the next article, we'll look at the key DBA statistics for PostgreSQL.
This article is part of a series: