Crunchy Spatial: Tile Serving
3 min readMore by this author
Beautiful, responsive maps are best built using vector tiles, and PostgreSQL with PostGIS can produce vector tiles on-the-fly.
However, to use vector tiles in a beautiful, responsive map, you need to be able to access those tiles over the HTTP web protocol, and you need to be able to request them using a standard XYZ tiled map URL.
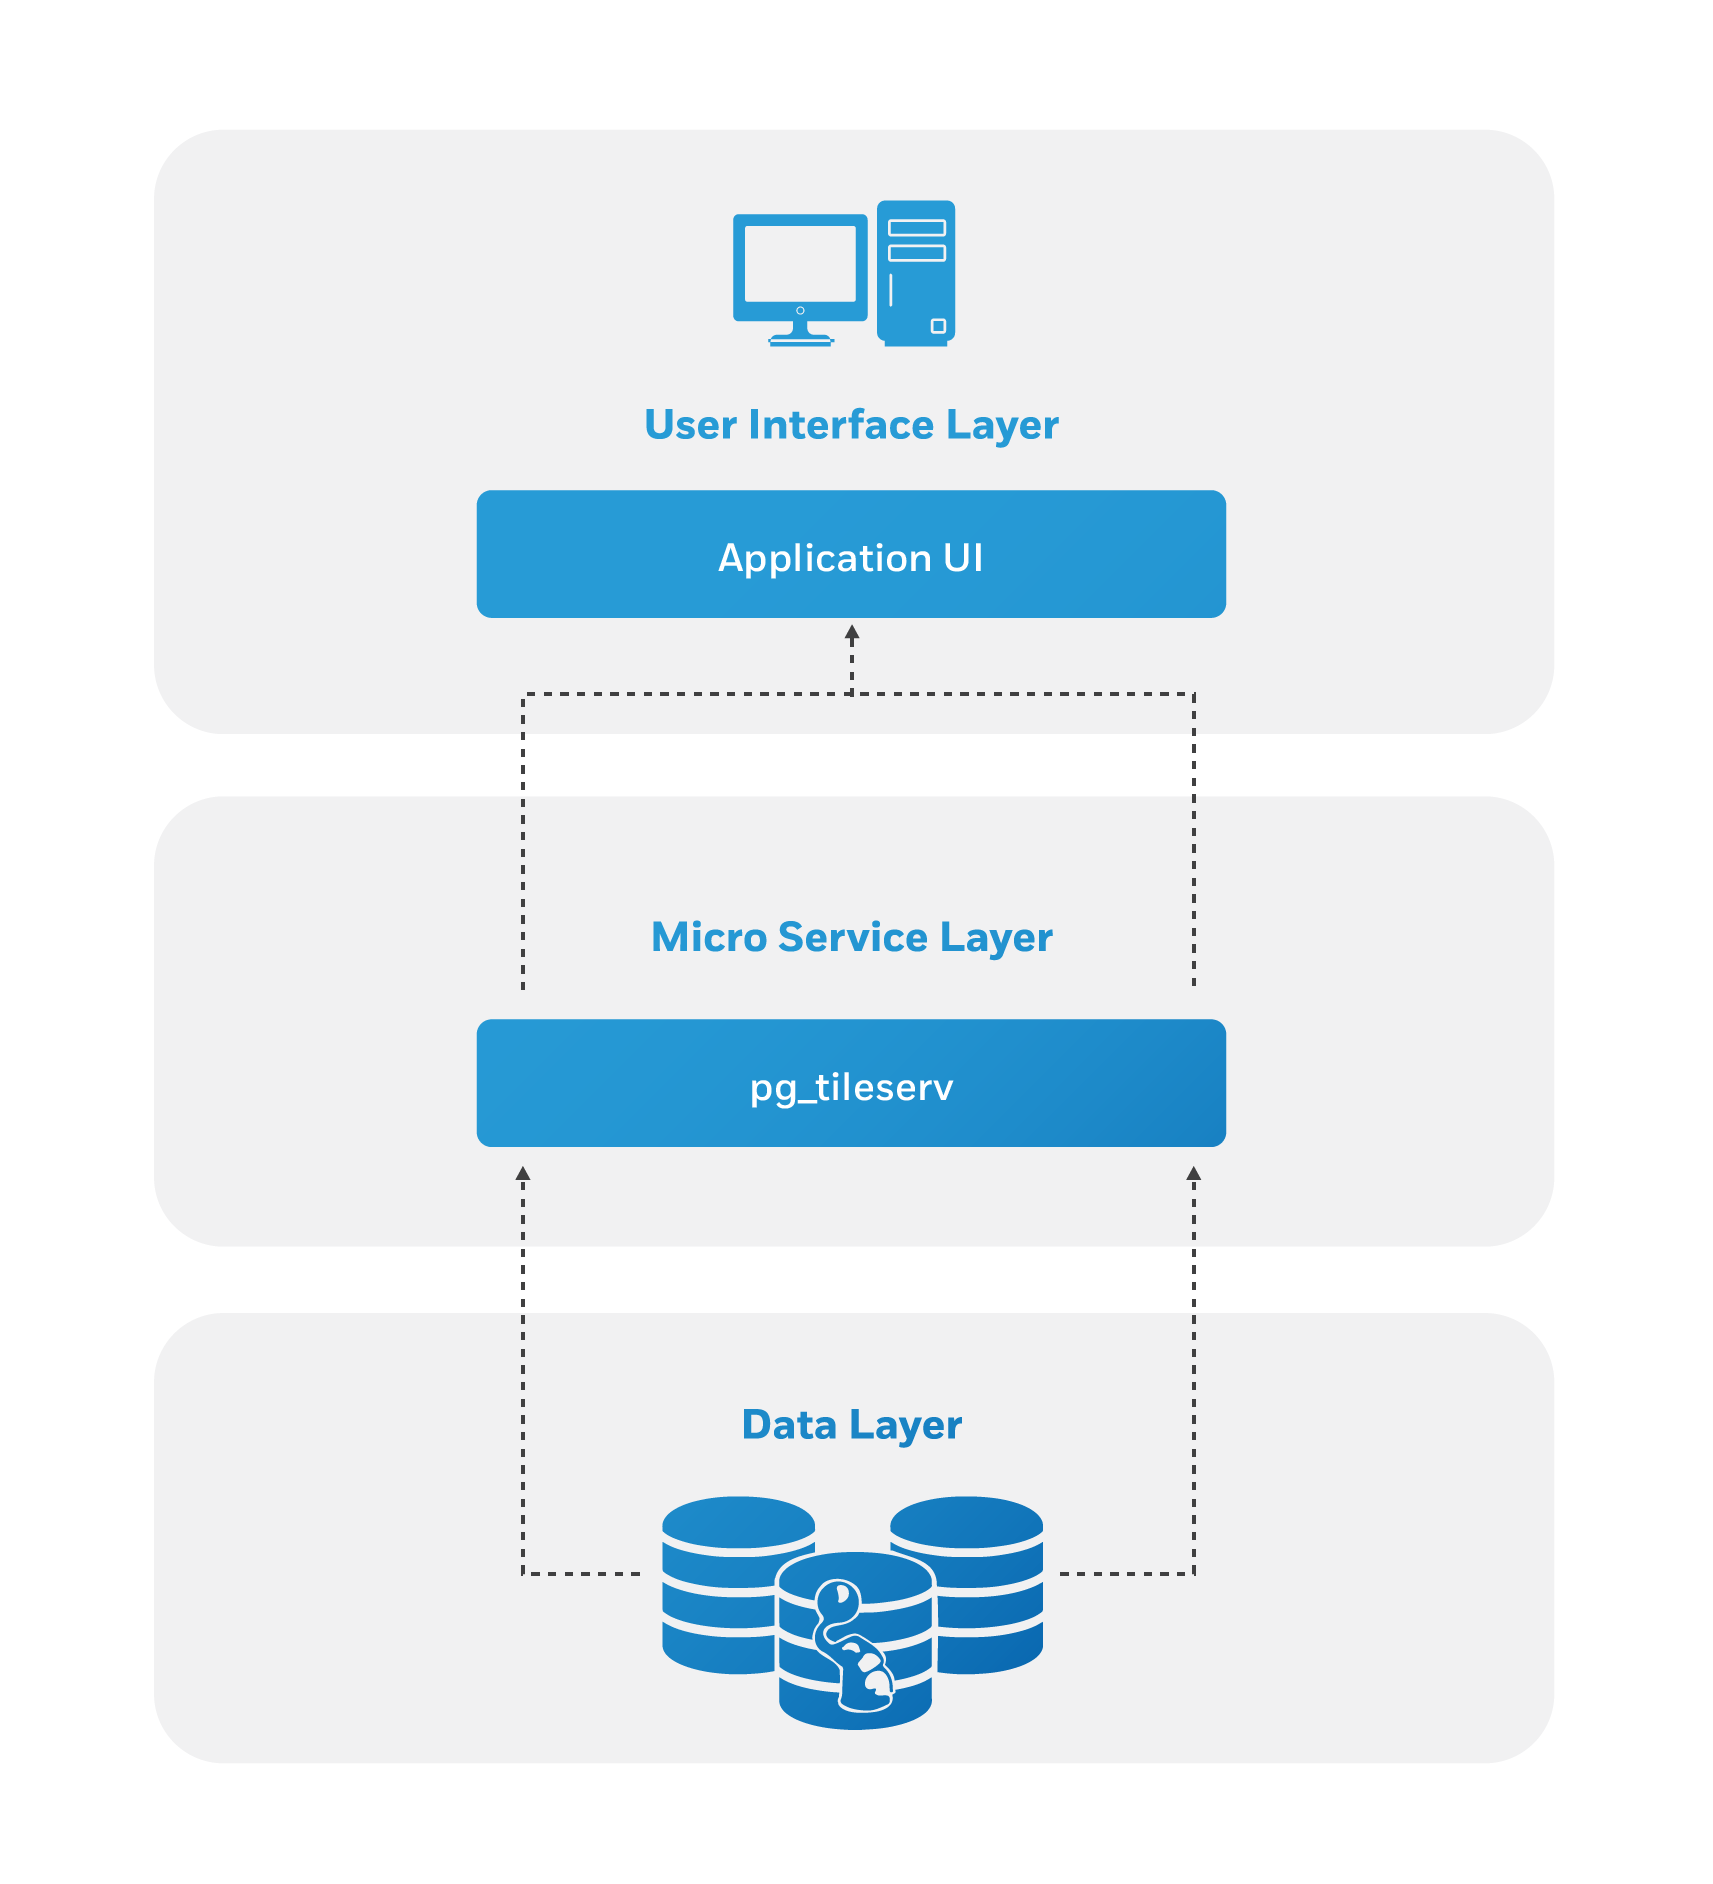
It's possible to write your own HTTP wrapper for the PostGIS vector tile generator, but you don't need to!
pg_tileserv is a lightweight vector tile server specifically written to publish tiles from a PostgreSQL/PostGIS database.
pg_tileserv has the following features:
- Written in Go to allow for simple deployment of binaries with no complex dependency chains or library versioning issues.
- Ready-to-run defaults so that basic deployment just requires setting a database configuration string and running the program.
- Simple web user interface to explore the published tile services, and view the services as maps.
- On-the-fly attribute filtering to strip out columns you don't want to retrieve from the server, for smaller, faster tiles.
- Function-based tile generation, so you can generate tiles from any function that takes in XYZ tile coordinates and outputs MVT tiles.
Want to see pg_tileserv in action? Here's a five-step demo! (Most of the steps just involve getting some spatial data in a database: if you already have a database, just skip down to step 3 and input your own database connection information).
Make a database, and enable PostGIS.
createdb postgisftw
psql -d postgisftw -c 'create extension postgis'
Download some spatial data, and load it into PostGIS.
curl -L -o https://www.naturalearthdata.com/http//www.naturalearthdata.com/download/50m/cultural/ne_50m_admin_0_countries.zip
unzip ne_50m_admin_0_countries.zip
shp2pgsql -s 4326 -D -I ne_50m_admin_0_countries | psql -d postgisftw
Download and unzip the pg_tileserv binary for your platform
Set the
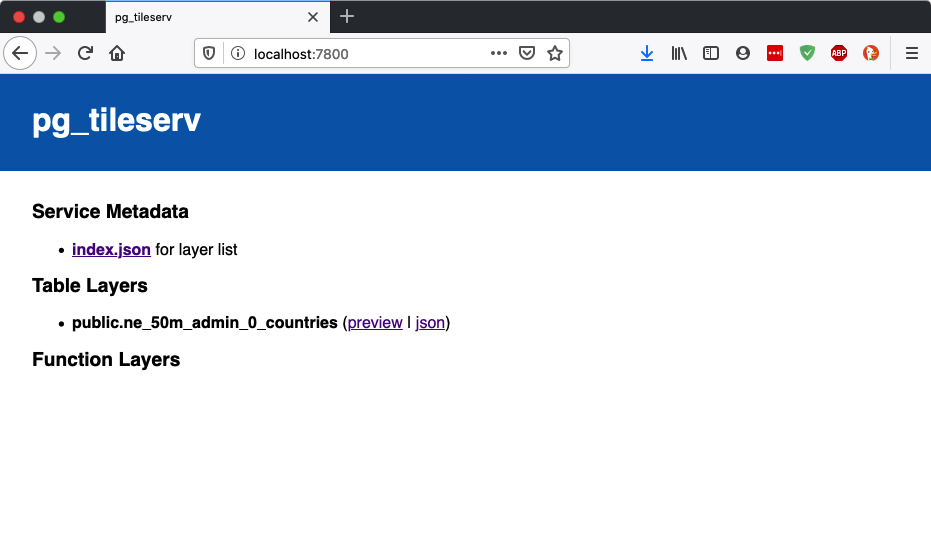
DATABASE_URLenvironment variable to point to your database, and start the service.export DATABASE_URL=postgresql://postgres@localhost:5432/postgisftw ./pg_tileserv --debugPoint your browser to the service web interface URL.
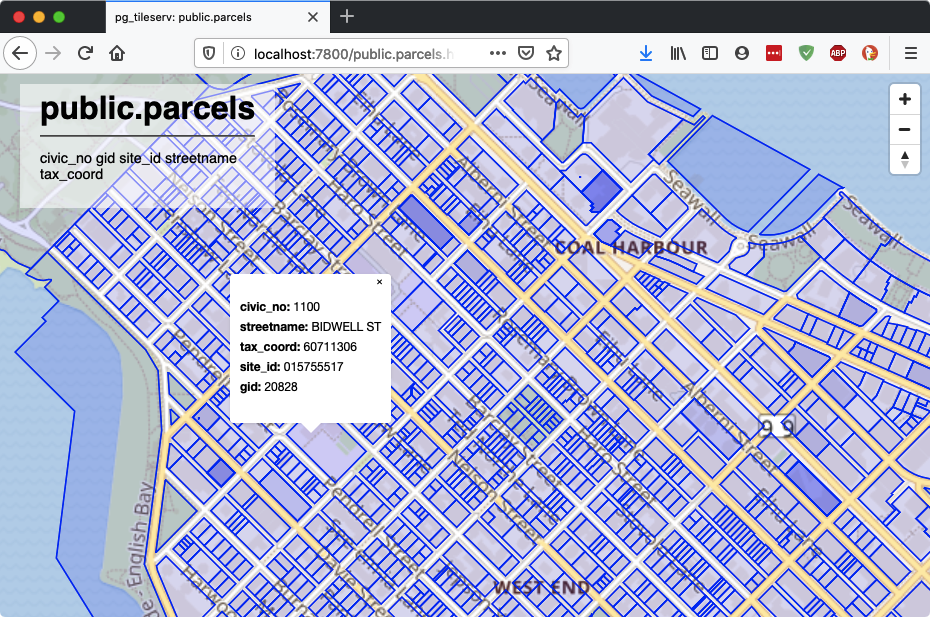
Explore the data!
The service includes both a human-viewable interface, and a JSON-based API for programmatic service discovery. The JSON API starting point is:
http://localhost:7800/index.json
You can see examples of maps that configure using the JSON API by viewing the source of the human-viewable interface.
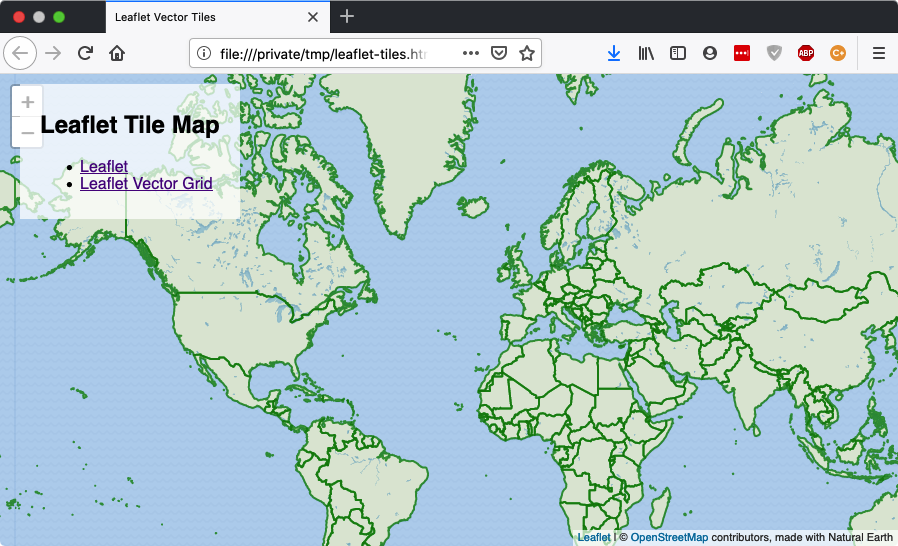
 Using the data loaded in this example, building a web map that visualizes the tiles is as simple as pointing to the tile source URL. A web map can be as small as these examples (Leaflet, Openlayers, Mapbox GL JS):
<html lang="en">
	<head>
		<meta charset="utf-8" />
		<title>Vector Tiles in Leaflet</title>

		<!-- CSS for Leaflet map -->
		<link
			rel="stylesheet"
			href="https://unpkg.com/leaflet@1.5.1/dist/leaflet.css"
			integrity="sha512-xwE/Az9zrjBIphAcBb3F6JVqxf46+CDLwfLMHloNu6KEQCAWi6HcDUbeOfBIptF7tcCzusKFjFw2yuvEpDL9wQ=="
			crossorigin=""
		/>

		<!-- JS for Leaflet map -->
		<script
			src="https://unpkg.com/leaflet@1.5.1/dist/leaflet.js"
			integrity="sha512-GffPMF3RvMeYyc1LWMHtK8EbPv0iNZ8/oTtHPx9/cc2ILxQ+u905qIwdpULaqDkyBKgOaB57QTMg7ztg8Jm2Og=="
			crossorigin=""
		></script>

		<!-- Leaflet plugin for vector tiles support -->
		<script
			type="text/javascript"
			src="https://unpkg.com/leaflet.vectorgrid@1.2.0"
		></script>

		<!-- Set up a full-screen map -->
		<style>
			html,
			body,
			#map {
				height: 100%;
				width: 100%;
			}
			body {
				padding: 0;
				margin: 0;
			}
			#map {
				z-index: 1;
			}
		</style>
	</head>

	<body>
		<!-- Put the map in this element -->
		<div id="map"></div>

		<script>
			// Leaflet map object
			var map = L.map('map').setView([0, 0], 2)

			// Add a base map layer to the map
			var baseUrl = 'https://maps.wikimedia.org/osm-intl/{z}/{x}/{y}.png'
			var baseLayer = L.tileLayer(baseUrl).addTo(map)

			// Add the tile layer to the map
			// https://www.naturalearthdata.com/http//www.naturalearthdata.com/download/50m/cultural/ne_50m_admin_0_countries.zip
			var vectorServer = 'http://localhost:7800/'
			var vectorLayerId = 'public.ne_50m_admin_0_countries'
			var vectorUrl = vectorServer + vectorLayerId + '/{z}/{x}/{y}.pbf'
			var vectorTileStyling = {}
			// Rendering options
			vectorTileStyling[vectorLayerId] = {
				fill: true,
				fillColor: 'green',
				fillOpacity: 0.1,
				color: 'green',
				opacity: 0.7,
				weight: 2,
			}
			var vectorTileOptions = {
				rendererFactory: L.canvas.tile,
				vectorTileLayerStyles: vectorTileStyling,
			}
			var vectorLayer = L.vectorGrid
				.protobuf(vectorUrl, vectorTileOptions)
				.addTo(map)
		</script>
	</body>
</html>
Related Articles
- British Columbia, Time Zones, and Postgres
6 min read
- Postgres Serials Should be BIGINT (and How to Migrate)
11 min read
- Postgres 18 New Default for Data Checksums and How to Deal with Upgrades
4 min read
- PostGIS Performance: Simplification
3 min read
- How to Read Postgres EXPLAIN: A Guide to Scan Types
9 min read