PostGIS For Newbies
7 min readMore by this author
PostGIS is one of the most awesome extensions for PostgreSQL and can turn a relational database into a really powerful GIS (Geographic Information System). The PostGIS community is really great about documentation and training and this post is aimed at getting you some resources on how to get started with the major components of using PostGIS as a super beginner. I’ll help you get a sample dataset up, import a shape file, and get that all published to a web browser.
What is PostGIS?
PostGIS is a Postgres extension for spatial data types like points, lines, and polygons to be stored inside a database. Most commonly you’ll see people using PostGIS with spatial points on a map or globe in longitude and latitude, but there’s some other interesting use cases out there like neuroscience and networking so it can be used for any system with spatial relationships. PostGIS also has a large set of functions that allow you to work with geography and geometry inside sql and indexes to make database tasks efficient.
PostGIS can be used to store spatial data, create and store spatial shapes, determine routes, calculate areas and distances. It is used by map makers, developers, and scientists in a variety of applications like real estate (Redfin), mapping and routing apps like Ride the City, antiquities, and NOAA.
In terms of project architecture, PostGIS will be the primary source of spatial data and often a desktop GIS client will be used to interact, update, change, or query the data. The database feeds a web application and user front end and in some cases other data tools. 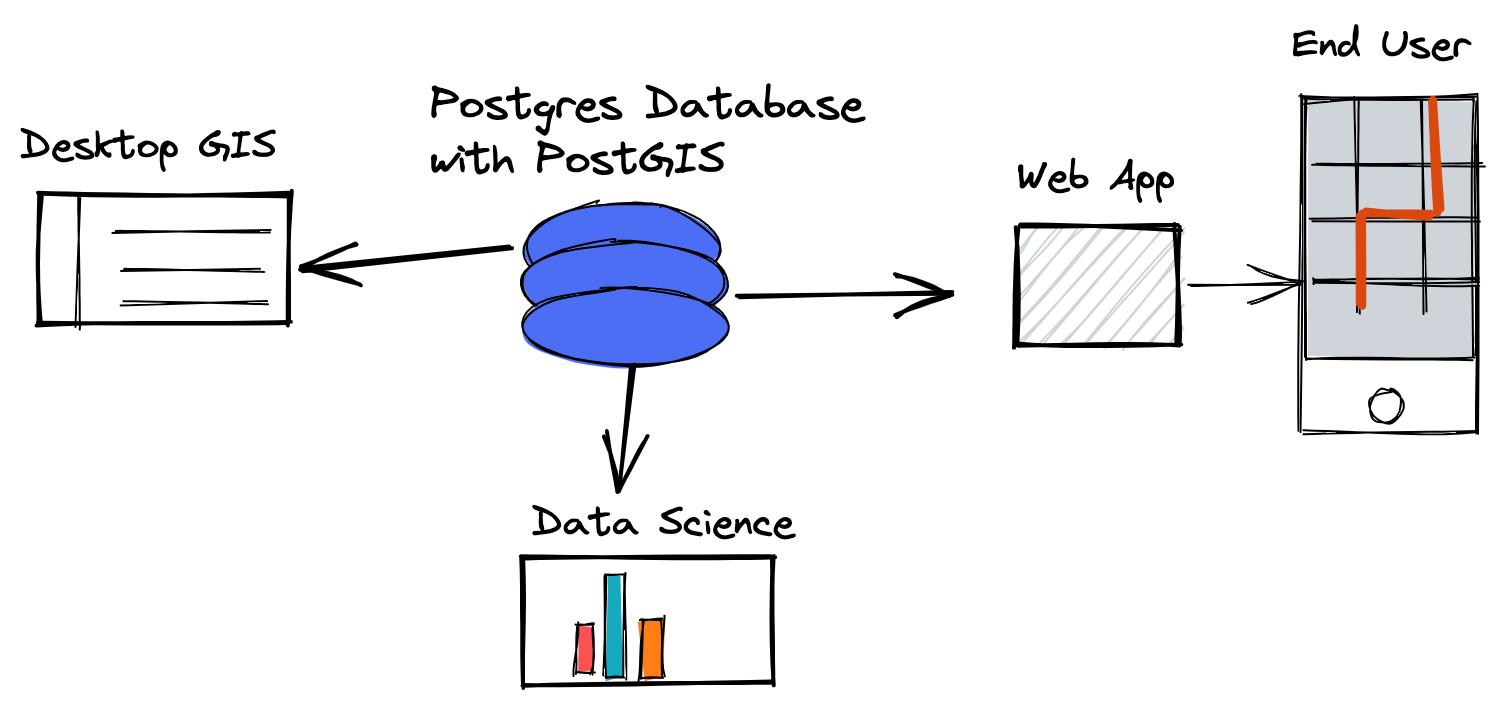
The Essential Tools
- Postgres: You need a working Postgres database, I always use Crunchy Bridge since it comes with all the PostGIS extensions out of the box and it's easy to spin and close down when I’m done.
- PostGIS: You just run
CREATE EXTENSION postgis;inside PostgreSQL to get going. - pgAdmin: You will very likely want a GUI interface for working with Postgres and PostGIS. pgAdmin has a nice 👁️ geometry viewer for seeing PostGIS data on map format. The primary use of pgAdmin is working with the data, so you’ll still need a desktop GIS to do lots of layering, labeling, and fancy map work.
- QGIS: You will very likely want a desktop app for working with GIS data, very similar to the GUI interfaces for databases like pgAdmin but with a lot more functions for loading maps, labeling and enhancing them.
- pg_featureserv: This is a quick way to expose your PostGIS data to a web service and API.
Sample PostGIS Data Load
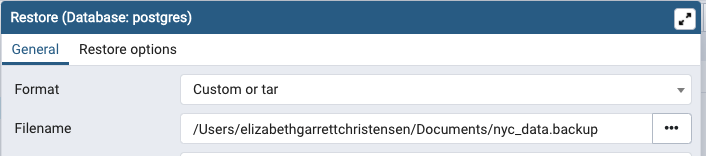
To work a little further into this tutorial, let’s load some PostGIS data into our database. You can use the same dataset as the PostGIS tutorial, so if you’ve done that before or are doing that next, you can use this same set. Using pgAdmin, connect to your database, and then you’ll need to create a database or use the postgis db. Then you’ll install PostGIS, CREATE EXTENSION postgis;. Then run a restore from the backup file.
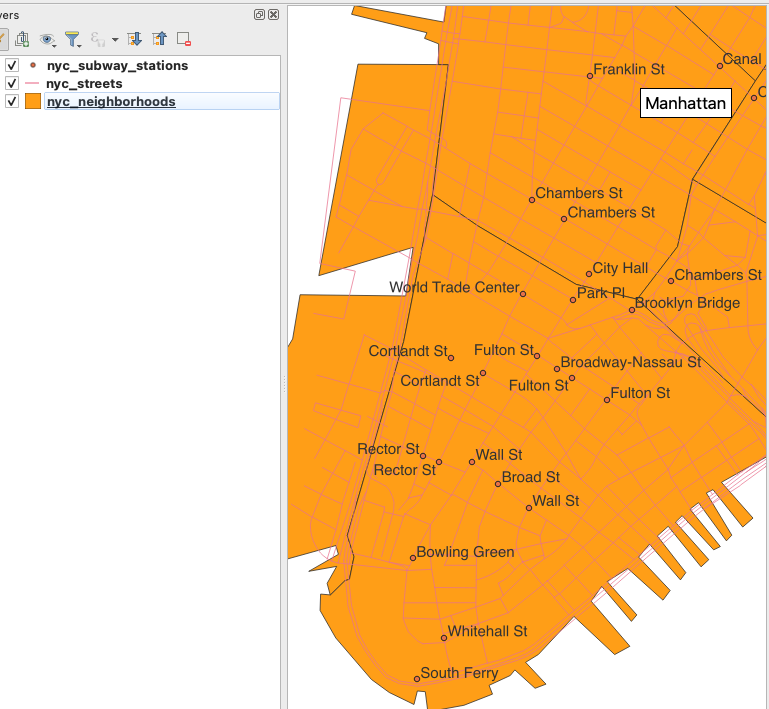
Refresh your database and you should be able to see the new tables. If you query the streets or neighborhoods and click to the Geometry Viewer, you can see your data.
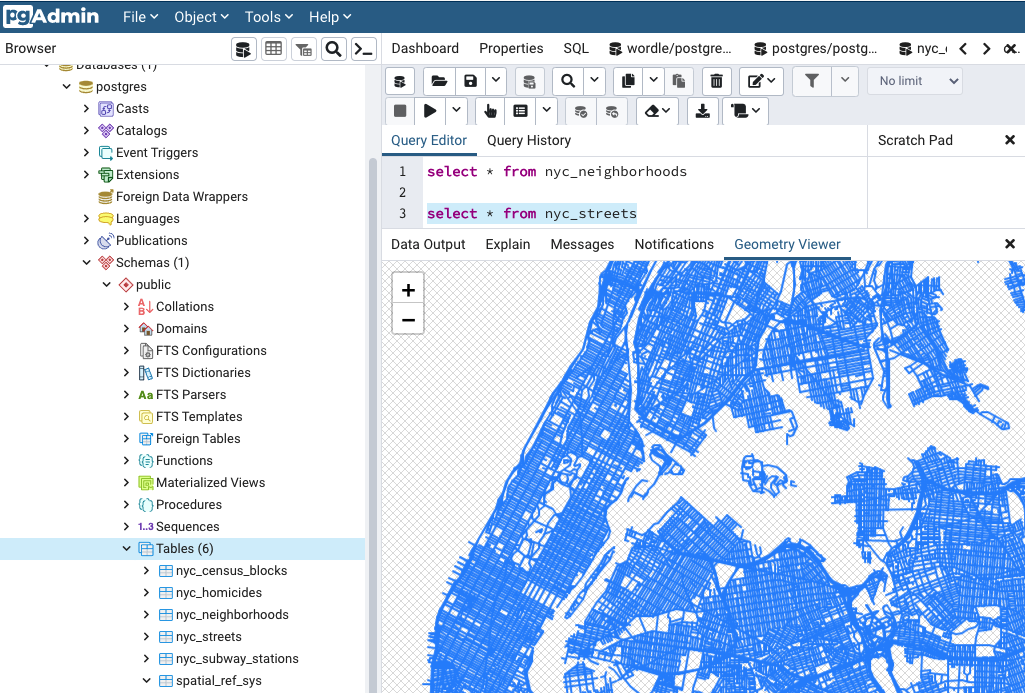
If you get into your data and do SELECT * FROM nyc_neighborhoods; in the data view you will see a column geom that is an opaque binary form and you might have been expecting to see long/lat data points. This is where the PostGIS functions start to come in. ST_AsText(geom) is a function to turn that binary into geometry points. If you want to see geometry / latitude longitude information, you’ll need to do SELECT gid, boroname, name, ST_AsText(geom) FROM nyc_neighborhoods; to see the actual lat/long data that’s being rendered on your screen.
Here’s some quick concepts for working with PostGIS SQL and geometry functions.
Finding single points
SELECT name, ST_AsText(geom)
  FROM nyc_subway_stations
  LIMIT 10;
result
"Cortlandt St"	"POINT(583521.854408956 4507077.862599085)"
"Rector St"	"POINT(583324.4866324601 4506805.373160211)"
"South Ferry"	"POINT(583304.1823994748 4506069.654048115)"
"138th St"	"POINT(590250.10594797 4518558.019924332)"
"149th St"	"POINT(590454.7399891173 4519145.719617855)"
"149th St"	"POINT(590465.8934191109 4519168.697483203)"
"161st St"	"POINT(590573.169495527 4520214.766177284)"
"167th St"	"POINT(591252.8314104103 4520950.353355553)"
"167th St"	"POINT(590946.3972262995 4521077.318976877)"
"170th St"	"POINT(591583.6111452815 4521434.846626811)"
Calculating area
In square meters
SELECT ST_Area(geom)
  FROM nyc_neighborhoods
  WHERE name = 'West Village';
result
1044614.5296485956
Calculating Distance
SELECT ST_Length(geom)
  FROM nyc_streets
  WHERE name = 'Columbus Cir';
result
308.3419936909855
Geometry & Geography
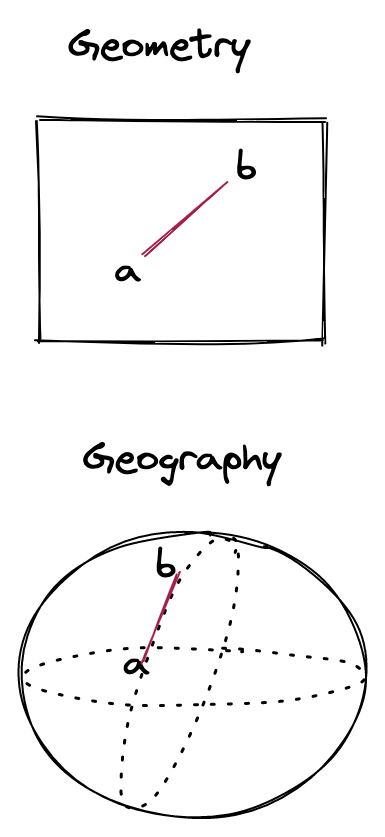 In PostGIS there is an important distinction between geometry and geography - geometry being cartesian and geography adding additional calculations for the curvature of the earth. In general, if you’re dealing with small areas like a city or building, you don’t need to add in the extra computing overhead for geography, but if you’re trying to calculate something larger like airline routes, you do.
This is how you could create a table of geography (ie casting data) from one of our existing tables into a new table has geometry points.
CREATE TABLE nyc_subway_stations_geog AS
SELECT
  Geography(ST_Transform(geom,4326)) AS geog,
  name,
  routes
FROM nyc_subway_stations;
Map Editing and Adding More Data with QGIS
Let’s open up this data set in QGIS now. Once this is installed locally, you’ll connect your database to it. You will add each table you want in the map as a layer and you can add labels and build from there.
Next, let’s add some new data. We can find a shapefile for anything we want to add in New York and we can add that to our dataset. I found something on the NYC Open Dataset website to add in building footprints. Shapefiles (.shp), actually have all the location data in them that we need as well built into the file itself.
Using the Layer – Add Layer – Add Vector I inserted this shape file into my map and you can see it creates a layer on top of the map I already had. With the QGIS DB Manager tool, you can insert your shape file layer data back into your PostGIS database as its own table. So easy, right?
Dig in more with QGIS in their docs and training manual.
For moving data in and out of PostGIS shp2pgsql and ogr2ogr are also really helpful. Kat has a nice write up about different ways to load PostGIS data to go beyond the PgAdmin backup file and simple shape file examples.
Publishing PostGIS Data to the Web
There’s quite a variety of ways to get PostGIS data to the web, from using a web framework like Python, GeoDjango, Rails, etc. There’s also some open source tools like Geoserver and Mapserver. All of these require quite a bit of setup, so I’ll skip them for this intro, but I will show you one of Crunchy Data’s tools that is a really easy way to get your spatial data in web app and on to the next steps, pg_featureserv. To run this locally as a quick test, install the files, set up your database environment string, start it with ./pg_featureserv, and you have it up at running at http://localhost:9000/index.html.
We’re doing a public beta testing of a feature to run small apps like this inside the database. You can spin up a web based map with one sql command (WOW!):
SELECT run_container('-dt -p 5435:5433/tcp -e DATABASE_URL="postgres://application:ExSdKI5SAH0tyBS3fMQgKsUWt3VEx1iWNx97ElShxalHo@p.tcidkauygvdljdrbxwkqlnjl5y.postgresbridge.com:5432/postgres" -e PGFS_SERVER_HTTPPORT=5433 docker.io/pramsey/pg_featureserv:latest');
High Five
Ok, you've loaded PostGIS demo data, added layers to QGIS, imported a shape file as a new layer, and added that back into your database. You learned a few sql functions for PostGIS and got a web map running in a browser. Pretty sweet, eh? If you’re ready for more there is so much good stuff out there I don’t even know where to start. I really like Paul Ramsey’s intro video. We have YouTube videos from a few years of PostGIS Days and there’s lots of good stuff on on the Crunchy blog with great PostGIS tips and tricks.
Related Articles
- British Columbia, Time Zones, and Postgres
6 min read
- Postgres Serials Should be BIGINT (and How to Migrate)
11 min read
- Postgres 18 New Default for Data Checksums and How to Deal with Upgrades
4 min read
- PostGIS Performance: Simplification
3 min read
- How to Read Postgres EXPLAIN: A Guide to Scan Types
9 min read