Waiting for PostGIS 3.2: ST_InterpolateRaster
4 min readMore by this author
A common situation in the spatial data world is having discrete measurements of a continuous variable. Every place in the world has a temperature, but there are only a finite number of thermometers: how should we reason about places without thermometers and how should we model temperature?
For many use cases, the right way to model a continuous spatial variable is a raster: a regularly spaced grid where each square in the grid contains a value of the variable. This works for temperature and precipitation; it works for elevation and slope; it even works for travel times and wayfinding.
For this blog post, we will build up a temperature surface for Washington State, using the discrete temperature measurements of a set of Department of Transportation (WSDoT) weather stations.
Getting the Data
In conceiving of this post, I envisioned finding a single page with a download of weather stations and associated weather data. Little did I know, few governments assemble that data in a convenient, easy-to-access form.
However, I did find this old page from the WSDoT that has the virtue of being really fast to access and actually containing real-time temperature data.
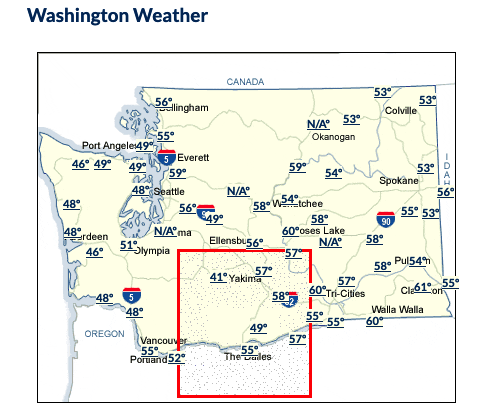
Behind the map it turns out the temperature data live as HTML overlays.

To turn the web data into a temperature table, I created a Rube Goldberg SQL query, that combines some of my favourite bits and pieces:
- The pgsql-http extension for direct access to HTTP pages inside the database.
- The regexp_matches() function to parse out the pixel coordinates and temperature values from the page HTML.
- Some dirty math to convert the pixel coordinates into spatial coordinates.
- Lots of WITH queries to chain it all together.
The final result looks like this:
CREATE MATERIALIZED VIEW mv_wadot_temp as
-- Read the HTML page from the web server
WITH html AS (
  SELECT content FROM http_get('https://wsdot.com/traffic/weather/default.aspx')
),
-- Parse the HTML to extract the data
data AS (
  SELECT regexp_matches(
    content,
    'left: (\d+)px;top: (\d+)px;.*station=(\d+).* title=''(.*?)''.*>(\d+)º', 'gn') as data
  FROM html
),
-- Cast the data into appropriate types
rows AS (
select
  SELECT[1]::integer AS i,
  data[2]::integer AS j,
  data[3]::text AS station,
  data[4]::text AS title,
  data[5]::integer AS degf
FROM data
)
-- Re-scale/translate the pixel coordinates to map coordinates
SELECT ST_SetSRID(ST_MakePoint(
  station,
  i * 1437 + 184630,
  (349 - j) * 1437 - 40500,
  degf),3691)::geometry(pointz, 3691) AS geom,
  title,
  degf FROM rows;
Because it's a materialized view, you can refresh the temperature data at any time by running REFRESH MATERIALIZED VIEW mv_wadot_temp.
Interpolate a Grid
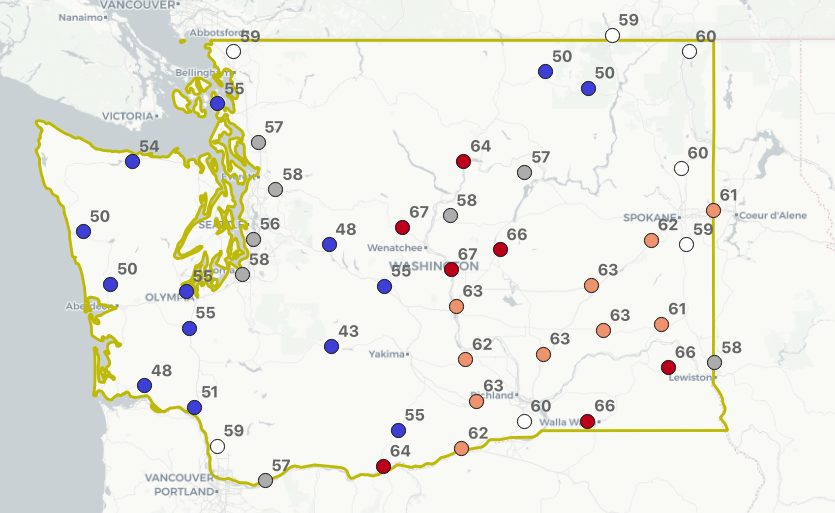
We can confirm the data are properly located in space by overlaying the points on a standard base map. Not bad!
To turn our points into an full raster surface, we will use the ST_InterpolateRaster() function.
ST_InterpolateRaster() is a binding to the GDAL library, and the functions behind the gdal_grid utility command. To keep things simple, ST_InterpolateRaster() uses the same format for controlling the interpolation algorithm and parameters: "algorithm:param1:value1:param2:value2"
The ST_InterpolateRaster() function needs the following inputs:
- A collection of points, with the value of interest ('degf' in our case) on the Z ordinate.
- A string with the interpolation algorithm and parameters.
- An empty raster (defining the raster location, cell size, width and height) into which to place the interpolation result.
The SQL to generate the raster looks like this:
-- Constants
DROP TABLE IF EXISTS wa_rast;
CREATE TABLE wa_rast AS
WITH inputs AS (
  SELECT
    500::float8 AS pixelsize,
    'invdist:power:5.5:smoothing:2.0' AS algorithm,
    ST_Collect(geom) AS geom,
    ST_Expand(ST_Collect(geom), 100000) AS ext
  FROM mv_wadot_temp
),
-- Calculate output raster geometry
-- Use the expanded extent to take in areas beyond the limit of the
-- temperature stations
sizes AS (
  SELECT
    ceil((ST_XMax(ext) - ST_XMin(ext))/pixelsize)::integer AS width,
    ceil((ST_YMax(ext) - ST_YMin(ext))/pixelsize)::integer AS height,
    ST_XMin(ext) AS upperleftx,
    ST_YMax(ext) AS upperlefty
  FROM inputs
)
-- Feed it all into interpolation
SELECT 1 AS rid,
  ST_InterpolateRaster(
    geom,
    algorithm,
    ST_SetSRID(ST_AddBand(ST_MakeEmptyRaster(width, height, upperleftx, upperlefty, pixelsize), '16BSI'), ST_SRID(geom))
  ) AS rast
FROM sizes, inputs;
The final surface fit provides an interpolated temperature for every point in the raster space!
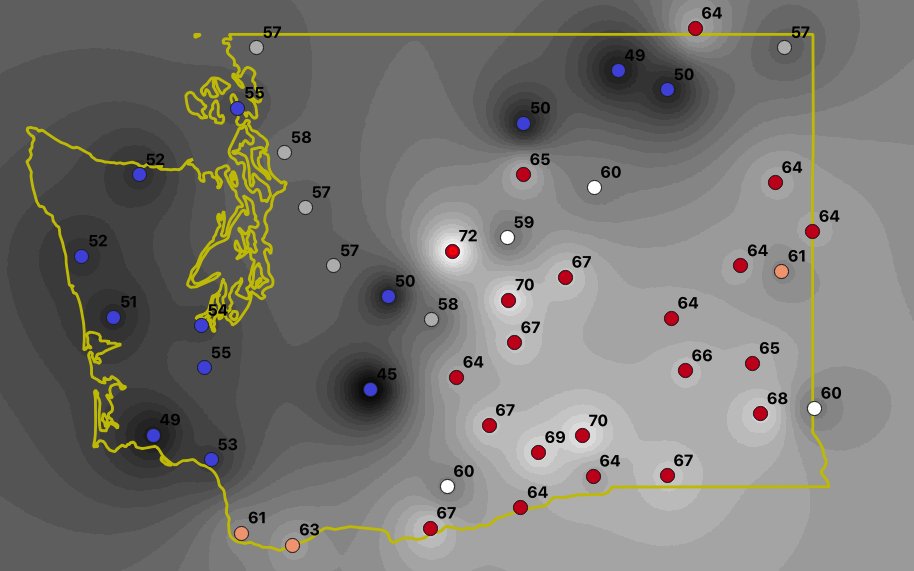
Temperature models are obviously not as simple as inverse-weighted distance, but this example should show how we can take point measurements and turn them into a continuous surface in SQL.
Conclusions
- You can use HTTP and regexp and glue to bodge together a refreshable data table from a web page.
- Surface interpolation provides a new way to leverage sparse spatial observations into domain-wide estimates.
- With more raster tools (to be discussed in upcoming posts) doing raster/vector calculations will allow for even more interesting data processing.
Related Articles
- British Columbia, Time Zones, and Postgres
6 min read
- Postgres Serials Should be BIGINT (and How to Migrate)
11 min read
- Postgres 18 New Default for Data Checksums and How to Deal with Upgrades
4 min read
- PostGIS Performance: Simplification
3 min read
- How to Read Postgres EXPLAIN: A Guide to Scan Types
9 min read